How to create a SVG blob thingy in HTML Canvas
You might have seen a lot of colorful blobs everywhere these days. It is simple and looks pretty without much effort. You even have tools like blobmaker.app to help you easily create blobs. Let me show you how you can code up your own svg blob thingy.
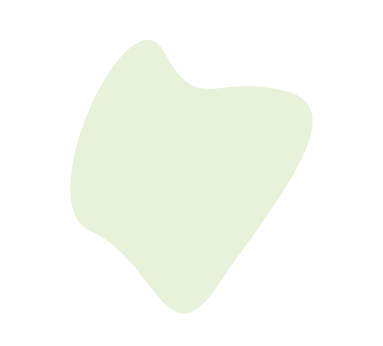
Here is what we will be building.

github and codesandbox
OK, here we go.
1. Prepare environment #
Below is the basic setup. Once this is out of the way, we will get to the actual code.
HTML #
<!DOCTYPE html>
<html>
  <head>
    <meta charset="UTF-8" />
    <meta name="viewport" content="width=device-width,initial-scale=1" />
    <title>Blob</title>
    <link rel="stylesheet" href="style.css" type="text/css" />
  </head>
  <body>
    <script src="blob.js"></script>
  </body>
</html>
CSS #
body,
html {
  margin: 0;
  width: 100vw;
  height: 100vh;
}

canvas {
  position: fixed;
  touch-action: none;
}
Javascript #
function create(root) {
  const canvas = document.createElement("canvas");
  canvas.setAttribute("touch-action", "none");
  root.appendChild(canvas);

  const resize = function() {
    canvas.width = window.innerWidth;
    canvas.height = window.innerHeight;
  };
  window.addEventListener("resize", resize);
  resize();
  return canvas;
}

const canvas = create(document.body); // get the canvas
const ctx = canvas.getContext("2d"); // initialize for 2d
2. Drawing the svg-blob #
The basic idea with drawing and svg-blob is that we have a circle and we are finding some points which lie inside
or outside of the circle and using them to draw a Bézier curve.
A quick intro to how Bézier curves work. We have a total of 4 points, out of which 2 will say where to start and where to end and two will say how to curve that line.
In our specific case, we find these points and draw an SVG path with a solid fill.
We have simplified drawing the SVG path by using a smooth curve (S) instead of a curve (C).
This is defined in the SVG path spec and can be used when the
points used to curve the lines are reflections of each other.
I am guessing that you have got the idea that we will need multiple sets of 3 points, start, end and
the thing that is used to curve the line. Actually we are only getting 2 points, just the end and curving thingy
because start is considered as the where the previous command ended.
A blob is just a collection of curved arcs whose inner area is filed with color.
The code for this looks something like this.
rintjust returns a random positive integer andgetRandomBetweenreturn a random positive or negative number between that range.
// Getting points needed to draw the circle
function getCirclePoints(base, radius) {
  const angles = [  // angles at which we compute points
    rint(0, 90 - 45),
    rint(90, 180 - 45),
    rint(180, 270 - 45),
    rint(270, 360 - 45)
  ];
  const positions = [];
  for (let a in angles) {
    const angle = (angles[a] * Math.PI) / 180;
    let ba = ((angles[a] - 20) * Math.PI) / 180;
    let rr = radius + getRandomBetween(40, 100);
    positions.push({
      x: base.x + radius * Math.sin(angle),
      y: base.y + radius * Math.cos(angle),
      mx: base.x + rr * Math.sin(ba),
      my: base.y + rr * Math.cos(ba)
    });
  }
  positions.push(positions[0]); // last one is same as first to make sure they line up
  return positions;
}
angle has to dealt with in radians
Now we have to create the d thingy for the path SVG element. This defines how to draw the path.
There are a lot of notation used for the d thingy, but the ones that you have to know are.
M: move to the specified positionS: smooth curve, takes 2 points and draw a bezier curveZ: close the loop
function drawPath(points) {
  let cpath = `M${points[0].x},${points[1].y}`;
  for (let point of points)
    cpath += `S${point.mx},${point.my},${point.x},${point.y}`;
  cpath += "Z";
  let p = new Path2D(cpath);
  ctx.clearRect(0, 0, canvas.width, canvas.height);
  ctx.fillStyle = "rgb(229, 244, 216)";
  ctx.fill(p);
}
With this in place, all we need to do is.
drawPath(getCirclePoints({ x: 300, y: 300 }, 150));A sample path will look something like this.
<svg
width="600"
height="600"
xmlns="http://www.w3.org/2000/svg"
>
<path d="M175.7,-137.1C200.2,-109.3,173.7,-37.9,150.8,23C127.8,84,108.4,134.3,74.6,147.8C40.9,161.3,-7.1,137.8,-54.7,114.6C-102.4,91.3,-149.7,68.1,-175.8,20.9C-201.9,-26.4,-206.9,-97.7,-174.1,-127.3C-141.3,-157,-70.6,-145,2.5,-147C75.6,-148.9,151.2,-164.9,175.7,-137.1Z" />
</svg>
With all that in place, you get something this, a simple blob. Here is the code for the static one in codesandbox.

3. Animating the svg-blob #
Now to animate the svg blob, we can make use of a library called es6-tween.
This is just an es6 rewrite of the tweenjs library.
Essentially we will be draw a new blob every 2 seconds and tween between them.
We create a drawBlob function like this ... and we call it in a setTimeoute. It is that simple.
import { Tween, autoPlay } from "es6-tween";
autoPlay(true);

let prevPoints = null;
function drawBlob(ctx) {
  let points = getCirclePoints({ x: 300, y: 300 }, 120);
  if (prevPoints === null) {
    drawPath(ctx, points);
  } else {
    let coords = [...prevPoints];
    new Tween(coords)
      .to(points, 1000)
      .on("update", p => {
        drawPath(ctx, p);
      })
      .start();
  }
  prevPoints = points;
}

drawBlob(ctx);
setInterval(() => {
  drawBlob(ctx);
}, 2000);
And there you go, hope that made some sense.